Utility Analytics: Everything You Need To Know
Utilities face the challenge of managing complex infrastructure and are charged with providing customers with the most reliable service possible. This crucial task means responding in the wake of major storms, pinpointing equipment failures, carefully connecting customer-reported outages with the relevant part of the network, and much more.
To meet this challenge, utility companies are increasingly turning to utility analytics. These metrics can be used to track equipment reliability, troubleshoot outages, and provide crucial real-time operational intelligence for decision-makers. They are also helping provide more accurate, timely, and information-rich customer communication than ever before.
Click here to learn about our Utility360 suite of real-time analytics.
What are utility analytics?
“Utility analytics” describes the software applications, infrastructure, and best practices used by utilities to collect and analyze operational data.
In many implementations, data on the utility network is reported via both customer call and device-level sensors. This data is correlated with both a GIS (Geographical Information System) and a rules-based map of the network itself. This integration helps pinpoint precisely where in the network a given issue is occurring.
Because they run huge networks of equipment and track thousands of customer accounts, most utilities are swimming in data; the challenge for analytics is driving the most possible value from this “big data.” The proliferation of field sensors and connected devices (IoT, “the Internet of Things”) means more data than ever before. Utilities need to situate this flow of sensor data within the complex network of equipment that comprises a utility’s “grid.” The US Department of Energy provides an excellent resource on growing applications for “Smart Grid” technology/IoT here.
Data also needs to be integrated with customer information. A Customer Information System (CIS) holds reams of customer data, premise and service point details, data related to billed usage and payments, and much more. These systems are designed to better meet the needs of increasingly sophisticated customers, provide flexible billing and invoicing, and optimize customer relationships.
Why are utility analytics important?
Use cases for utility analytics are growing fast for a reason. They help utilities digest huge volumes of data to analyze a wide array of critical operational variables. Utility analytics provide vital insight for functions that include:
- Preventative Maintenance and Asset Management
- Usage Monitoring and Forecasting
- Outage Monitoring and Management
- Regulatory Reporting
- Continuous Service Improvement
- Strategic Planning
- Customer Feedback and Communication
- Fraud Prevention
Are utility analytics regulatorily required?

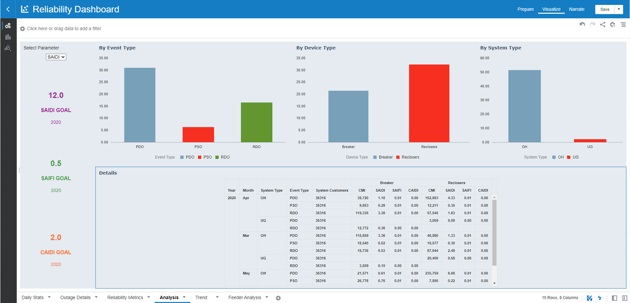
Utility360 Reliability Dashboard
Certain utility analytics are also mandated by regulators. While regulatory requirements may vary based on locality, reporting metrics used by the Federal Energy Regulatory Commission (FERC) are broadly representative. FERC issues and enforces these standards via the Electric Reliability Organization (ERO) for North America, the North American Electric Reliability Corporation (NERC), which oversees both the US and Canada. The NERC works with various regional entities to monitor and enforce reliability standards.
The most fundamental reporting metrics (including acronyms like SAIDI, CAIDI, and SAIFI) are based on IEEE definitions of service reliability: we provide a breakdown of key terms here.
Why are real-time utility analytics important?
While archived data is useful for studying historical patterns like usage and weather, the most impactful utility analytics implementations need to provide near real-time analytics. When a storm rolls in, for example, utility leaders need quick feedback on factors like:
- Infrastructure Vulnerability: what equipment is likely to be affected by the predicted storm path?
- Outages: which accounts and network segments have reported an outage?
- Restoration: what is the estimated time of restoration for a given account?
- Crew Status: which crews are on shift, where are they assigned, and how should their restoration work be prioritized?
What tools help companies use utility analytics more effectively?
Analytics can help utilities operate more efficiently and precisely. But they will only provide maximum value if they can be digested and transformed into a format that is readily usable by decision-makers.
High volumes of raw data without the right tools may only result in overwhelming information. Deloitte notes that “...there is a fine line between information opportunity and information overload. Companies that fall short in managing and leveraging the deluge of data may find it increasingly difficult to meet the needs of their internal and external customers.”
Utility analytics dashboards help gather relevant metrics and aggregate them into a user-friendly interface for utility decision-makers. Different dashboards can be configured to display different categories of information depending on the challenge at hand, including:
- Customer: a snapshot of critical and priority customers with their account details readily available.
- Crew: track key crew management variables like availability and on/off shift status.
- ETR: analyze estimated time to restoration (ETR) through multiple lenses like crew vs. system generated ETRs, impending ETRs across various timeframes, and how many times a given ETR has been changed.
- Outage: provide the most crucial information for planning a response in the wake of a storm, like projected storm paths and equipment failures.
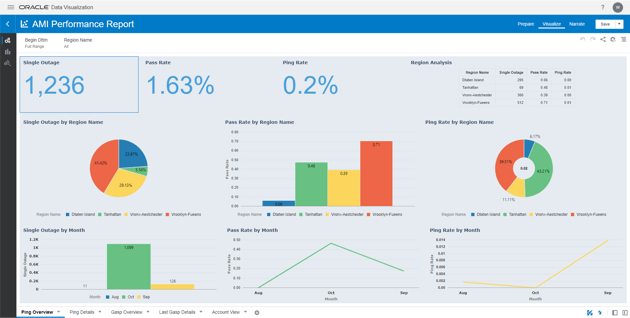
- AMI: review key data from advanced metering infrastructure (AMI) to understand costs and customer usage patterns more precisely.

Utility360 AMI Performance Report
Outage maps are another excellent example of a tool that helps generate the most possible value from utility analytics. Geographic visualization helps utilities quickly ascertain key facts, like where storm damage is focused, or which areas of the grid are encountering the most equipment failures. Outage maps are not just an asset that is useful for internal operations: external versions can also be generated so that customers can quickly see where outages are occurring. However, it is crucial to keep internal and external maps in sync to avoid any misinformation to customers.
How do utilities manage analytics?
Most utility businesses use software like a network management system (NMS) and/or an outage management system (OMS) to collect and store incoming data. While these systems provide an essential foundation, they don’t offer a comprehensive set of tools for gleaning the most possible value from collected data.
Managing utility analytics effectively can be a real business challenge. To get the most out of their data, for example, utilities need to:
- Integrate data from multiple silos (ideally in near real-time): incoming data from customer-facing systems, meters, device monitoring systems, and more, all need to be integrated.
- Keep data synchronized across multiple repositories: key data streams need to stay synchronized and consistent across all repositories for maximum data quality.
- Institute effective data visualization: from routine KPI tracking to highly customizable operational maps and dashboards, visualization is essential for transforming raw data into actionable operational intelligence.
Utility Analytics Solutions: HEXstream
HEXstream has a deep well of experience helping utilities get the most out of their data. From managing cloud migrations, to developing strategic roadmaps, to offering turnkey analytics solutions (including customizable dashboards and outage maps), we provide utilities with the services, tools, and expertise they need to use data more effectively than ever before.
Let's get your data streamlined today!
Other Blogs
Water Affordability 101
Affordable access to clean, safe water is a fundamental requirement of human well-being. We depend on water not only to drink, but to cook, bathe, san
A New Imperative for Utilities to Manage their Unbilled Revenue
“While regulators generally allow utilities to recover prudently incurred costs from ratepayers, utilities are always cognizant of the effect rising c
Why Utilities Are Finally Flying to the Cloud
Despite unique industry challenges, utility organizations are increasingly adopting cloud-based infrastructure. In this blog, we focus on the specific
