Easy ETL Monitoring—Benefits Of The Extract/Transform/Load Dashboard
By Bharath Moola, HEXstream data-warehouse specialist
HEXstream has successfully implemented ETL-monitoring dashboards for various clients, managing their extract/transform/load(ETL) processes. Clients often require an interface to monitor ETL job statuses, track job durations, and promptly identify issues such as failures or jobs running for extended periods of time.
To address these concerns, HEXstream has developed a comprehensive ETL Monitoring Dashboard using Oracle Business Intelligence Enterprise Edition (OBIEE). This dashboard comprises four essential reports: Total Jobs Count by Duration, Total Jobs Count by Status, Average Hourly Trends, and Latest Job Run Time by Status.
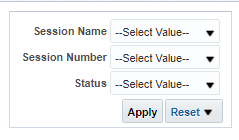
These reports offer detailed insights into ETL job performance and enable users to filter data by session name, session number, and job status.
The data necessary for this dashboard is primarily sourced from the ETL-execution environment's metadata tables, such as SNP_SESSION. However, the dashboard's design and data sources can be customized to meet specific client requirements.
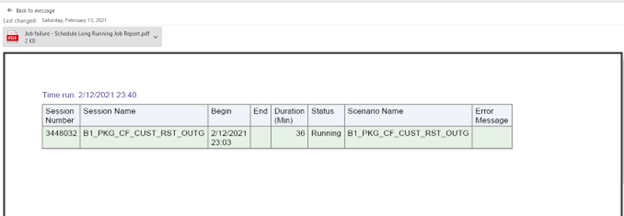
In addition to the ETL Monitoring Dashboard, HEXstream has implemented an OBIEE agent capable of sending email notifications when ETL jobs encounter issues, such as failures or extended run times.
This proactive monitoring approach and the email notification feature ensure the smooth operation of ETL processes, regardless of the specific ETL environment. HEXstream's ETL Monitoring Dashboard simplifies the day-to-day management of ETL tasks and fosters better decision-making based on real-time insights.
By offering a comprehensive ETL monitoring solution, HEXstream exemplifies its commitment to delivering practical and efficient solutions that enhance data operations and business processes for clients across different industries.
Let's explore the dashboard...
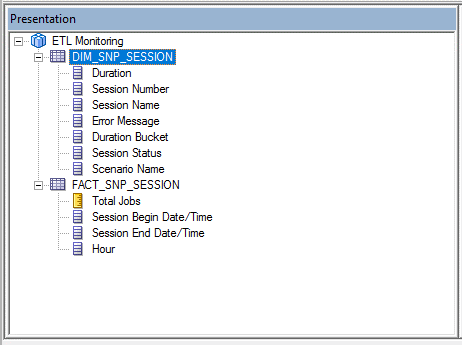
Step 1: Create a connection pool in the RPD for OUA_WORK schema to a bring SNP_SESSION table to the physical layer
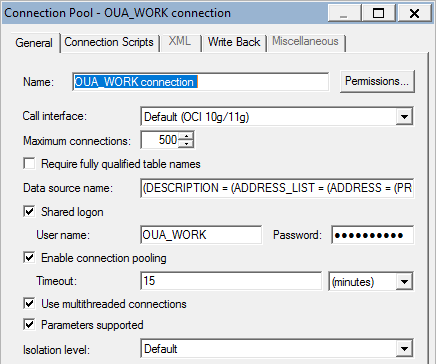
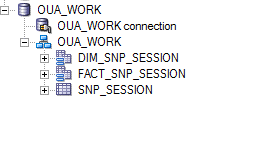
Step 2: Create two aliases for the SNP_SESSION table and assume one as dimension table and another as fact table
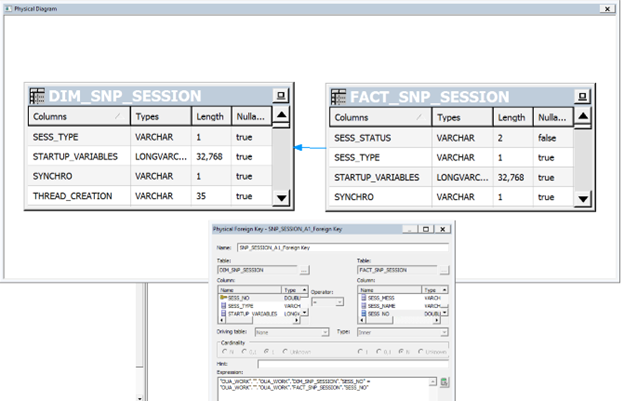
Step 3: Create a self-join for dimension and fact tables using SESS_NO
Step 4: Bring required fields and develop business-model layer
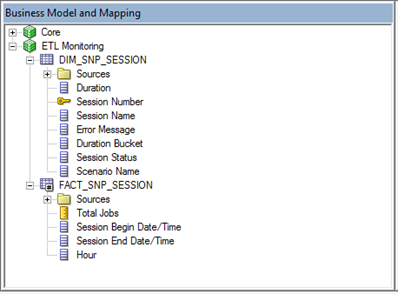
Step 5: Create a new subject area and bring business-model tables to presentation layer
Dashboard prompts:
Dashboard reports:
1. Total jobs count by duration—This dashboard report helps to understand which ETL jobs are taking more time to run. Total jobs are grouped based on duration bucket with details in drill-down report.
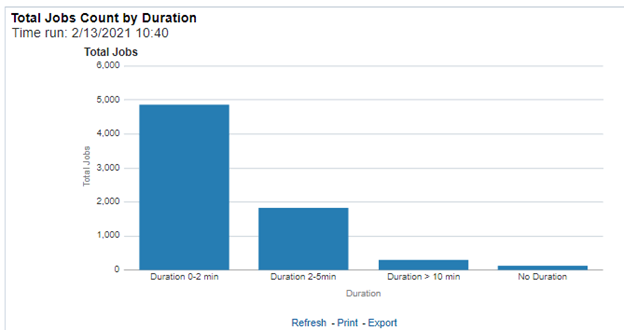
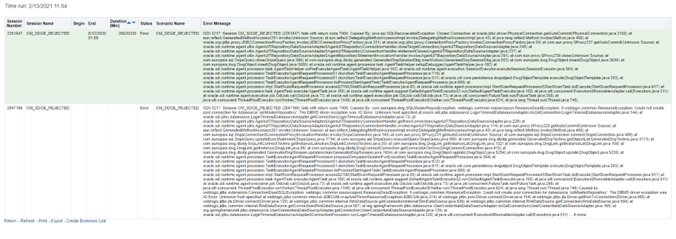
Drill-down report:

2. Total jobs count by status—This dashboard report helps to understand total jobs in different status. Total jobs are grouped based on session status with details in drill-down report.
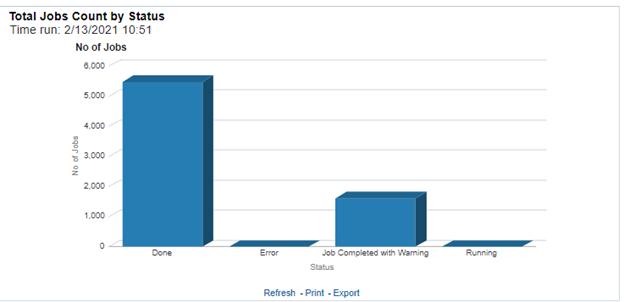
Drill-down report:
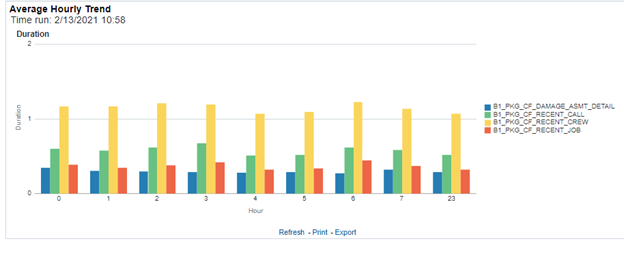
3. Average hourly trend—This dashboard report helps to understand how long these jobs are taking to complete in different hours.
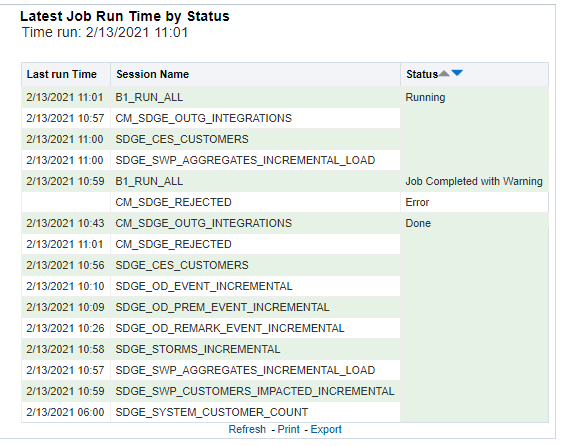
4. Latest Job run time by status—This dashboard report helps to understand latest job run time and status of each ETL job.
Email notification:

Let's get your data streamlined today!
Other Blogs
A New Imperative for Utilities to Manage their Unbilled Revenue
“While regulators generally allow utilities to recover prudently incurred costs from ratepayers, utilities are always cognizant of the effect rising c
Five Keys to Keeping Your Cloud Optimized
The cloud can deliver extraordinary flexibility, scalability, and performance, which is why so many utilities are flying to the cloud. But while the c
Water Affordability 101
Affordable access to clean, safe water is a fundamental requirement of human well-being. We depend on water not only to drink, but to cook, bathe, san
